Marketplace listing
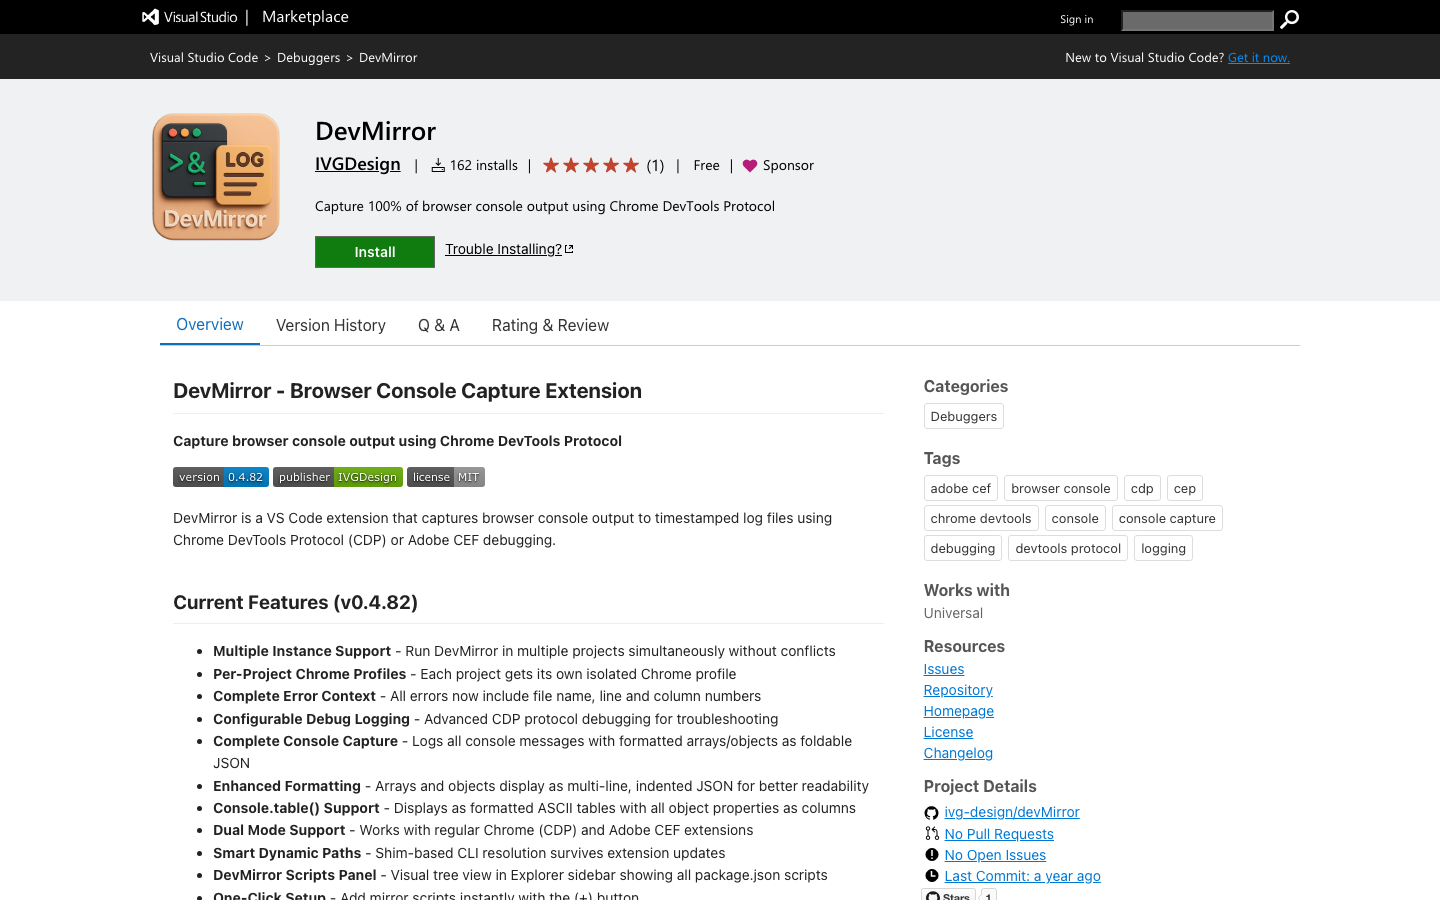
DevMirror on the VS Code Marketplace (captured 2026-10-21).
Tools
VS Code extension that mirrors browser console output to timestamped log files via Chrome DevTools Protocol or Adobe CEF debugging. For web and CEP developers.
DevMirror: browser console capture for VS Code
A VS Code extension that writes what a browser or Adobe panel logs to its console into timestamped files in your project, so you and your tools can read them.
It connects through the Chrome DevTools Protocol (CDP) or Adobe's CEF debugging port, captures `console.*` output and writes it to log files. Handy for AI coding assistants, which can read the files instead of asking you to paste console output.
Debugging web apps and Adobe CEP panels (After Effects, Photoshop and others) from inside VS Code; feeding console logs to an assistant.
Free, MIT licensed. Version 0.4.82 (2025-09-26) on the VS Code Marketplace (publisher IVGDesign; 162 installs as of 2026-10-23) and as a .vsix on GitHub.
TypeScript VS Code extension using a CDP/WebSocket client and file writers.
DevMirror on the VS Code Marketplace (captured 2026-10-21).

Extension icon 372x372 (Marketplace icon)
Explore motion design and interactive animation services, or get in touch about your project.